How does Oura compare to Polar? Long‑Term Sleep Trends Compared
TL;DR
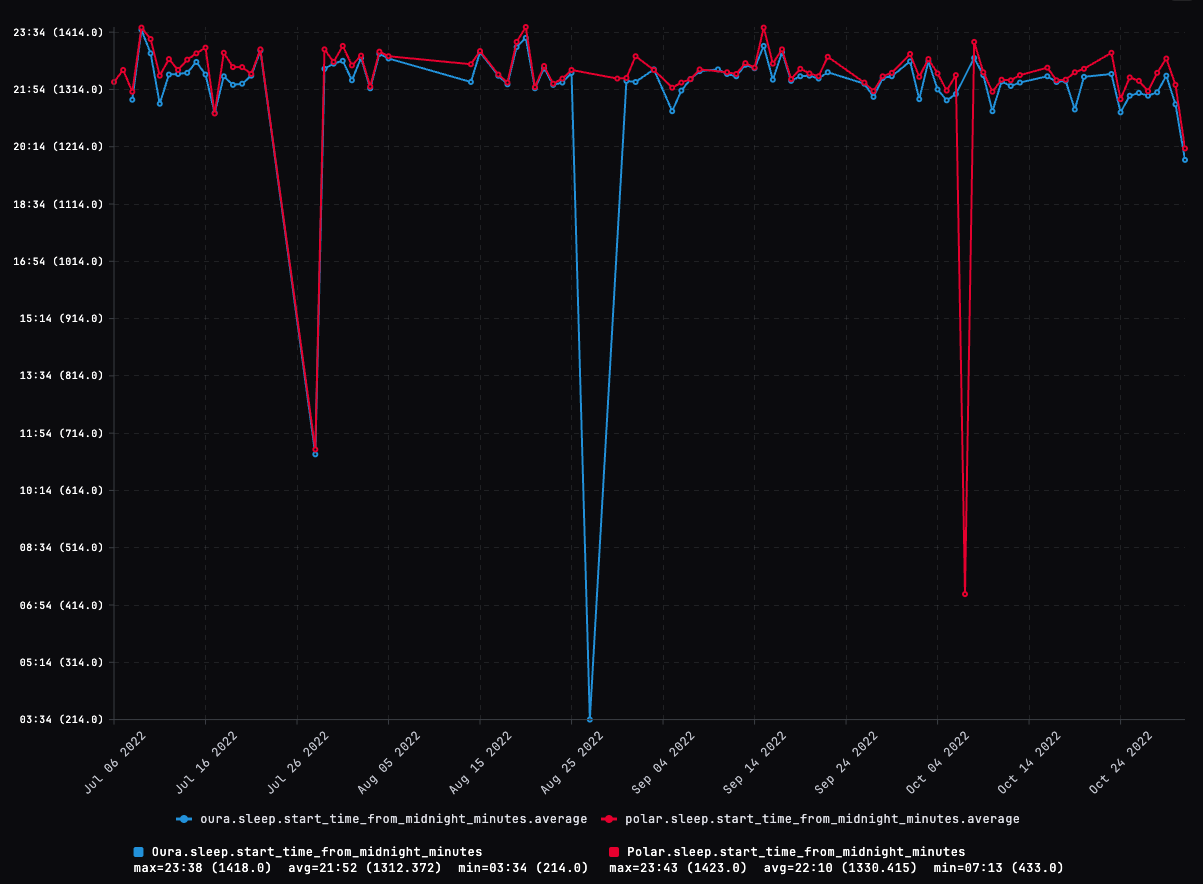
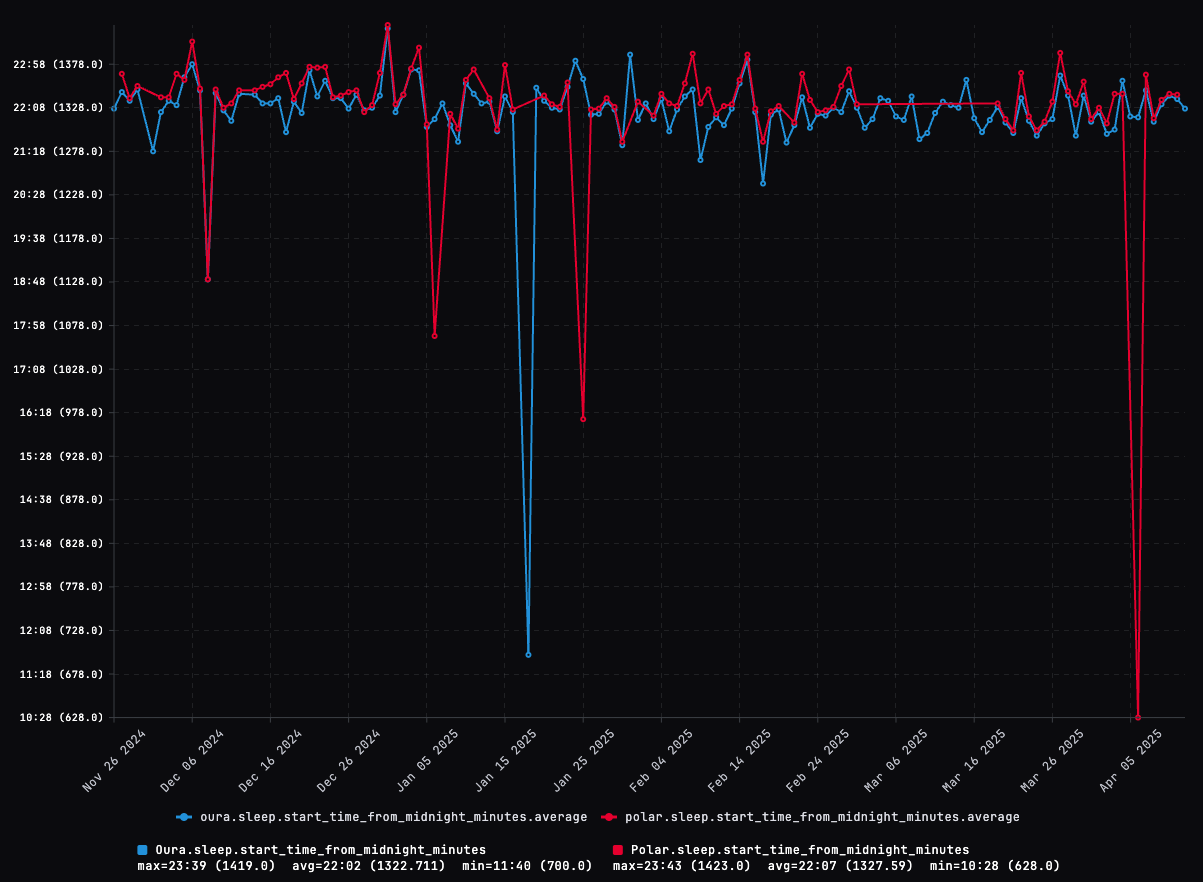
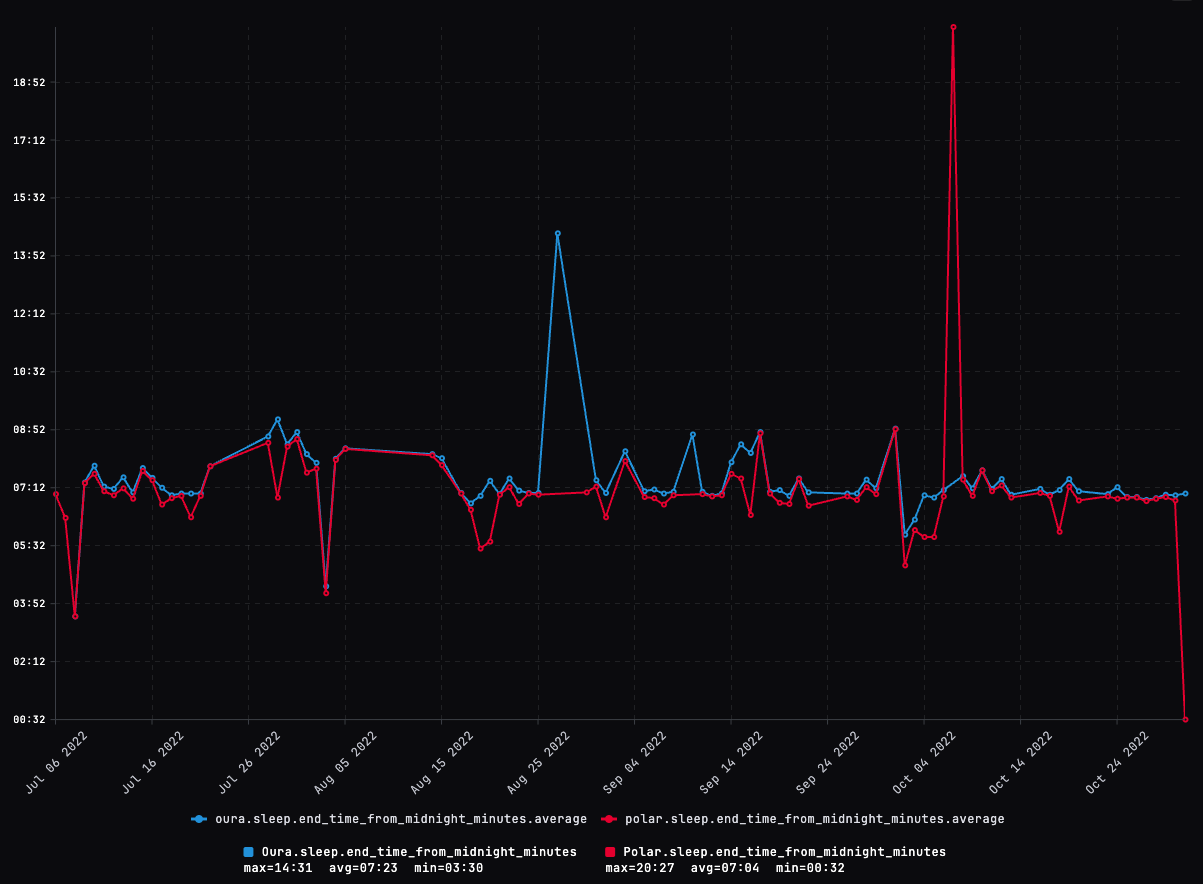
- Sleep start and end times are quite similar between Oura and Polar across both measurement periods.
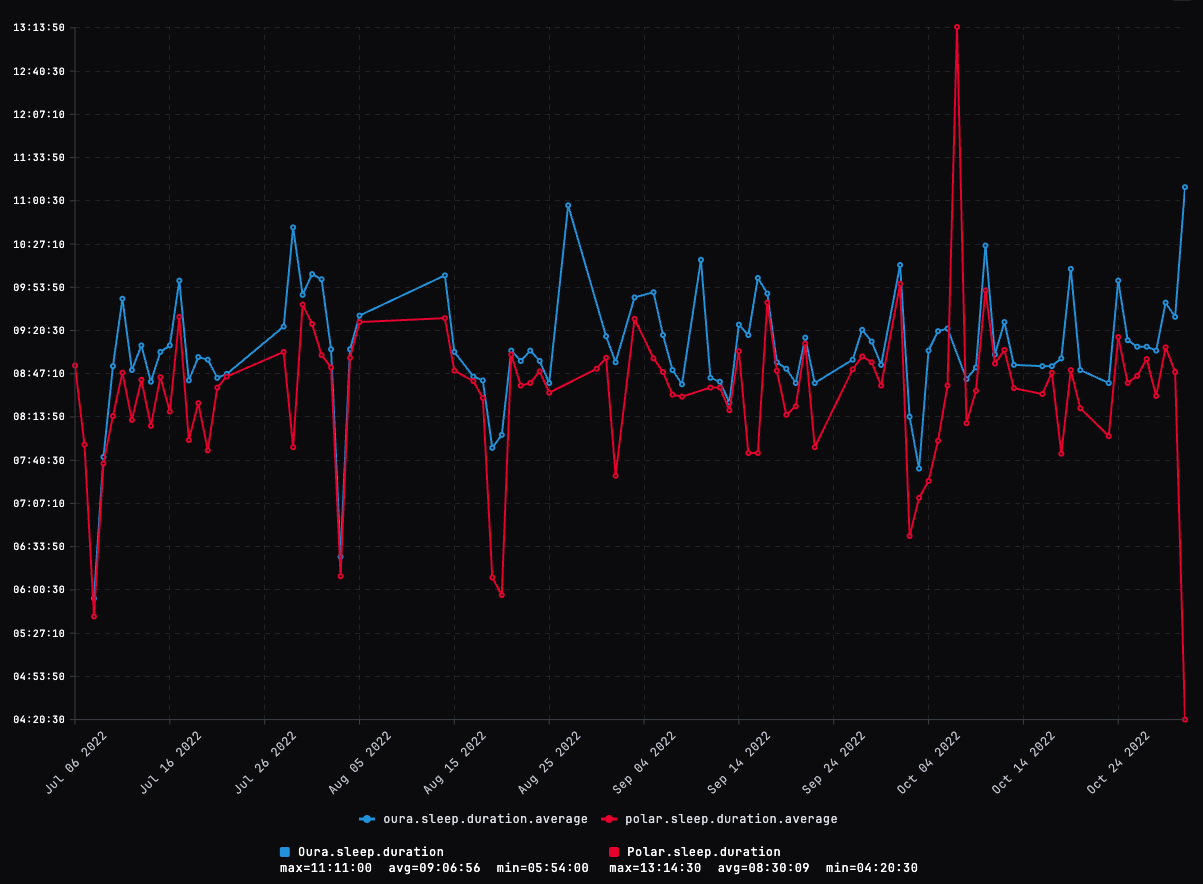
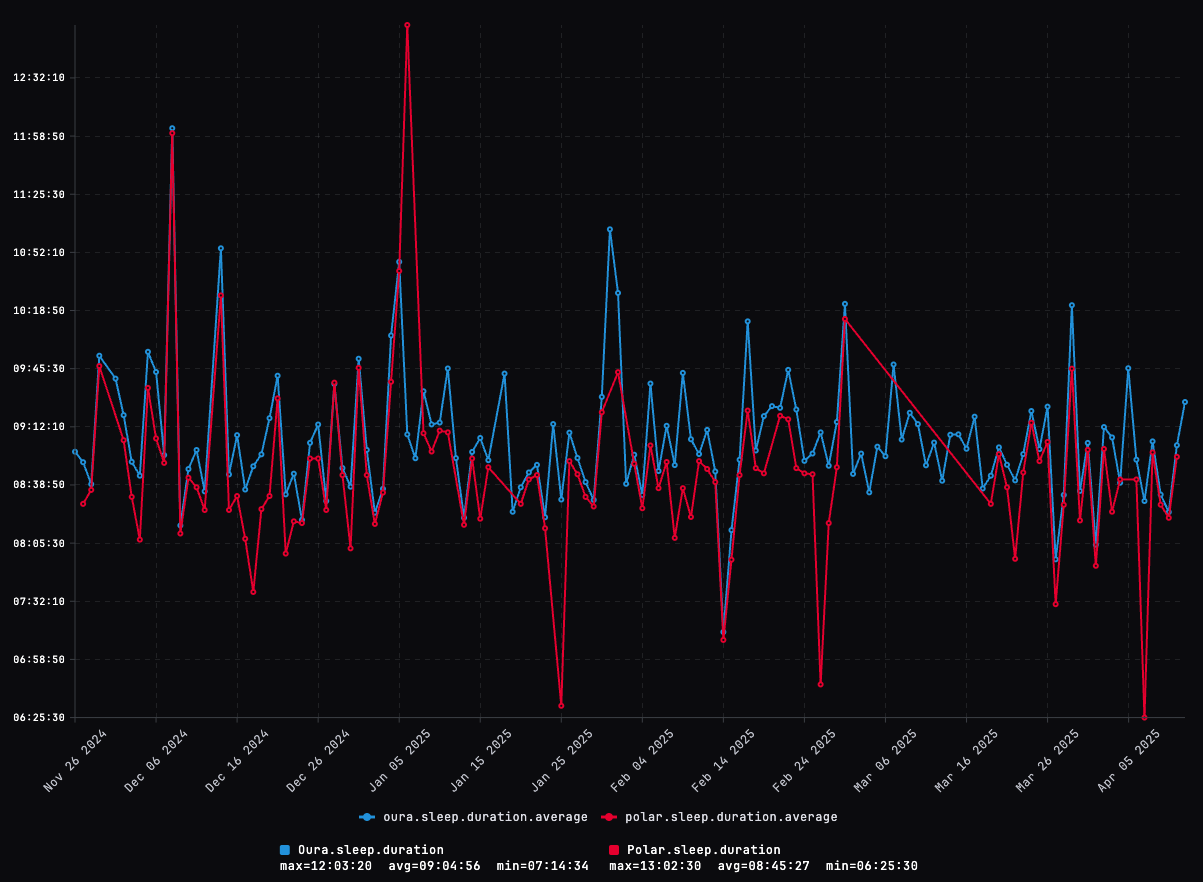
- Total sleep duration trends are also close, with differences mostly from outliers and missing nights.
- Resting HR correlates moderately to strongly between devices; averages are nearly identical.
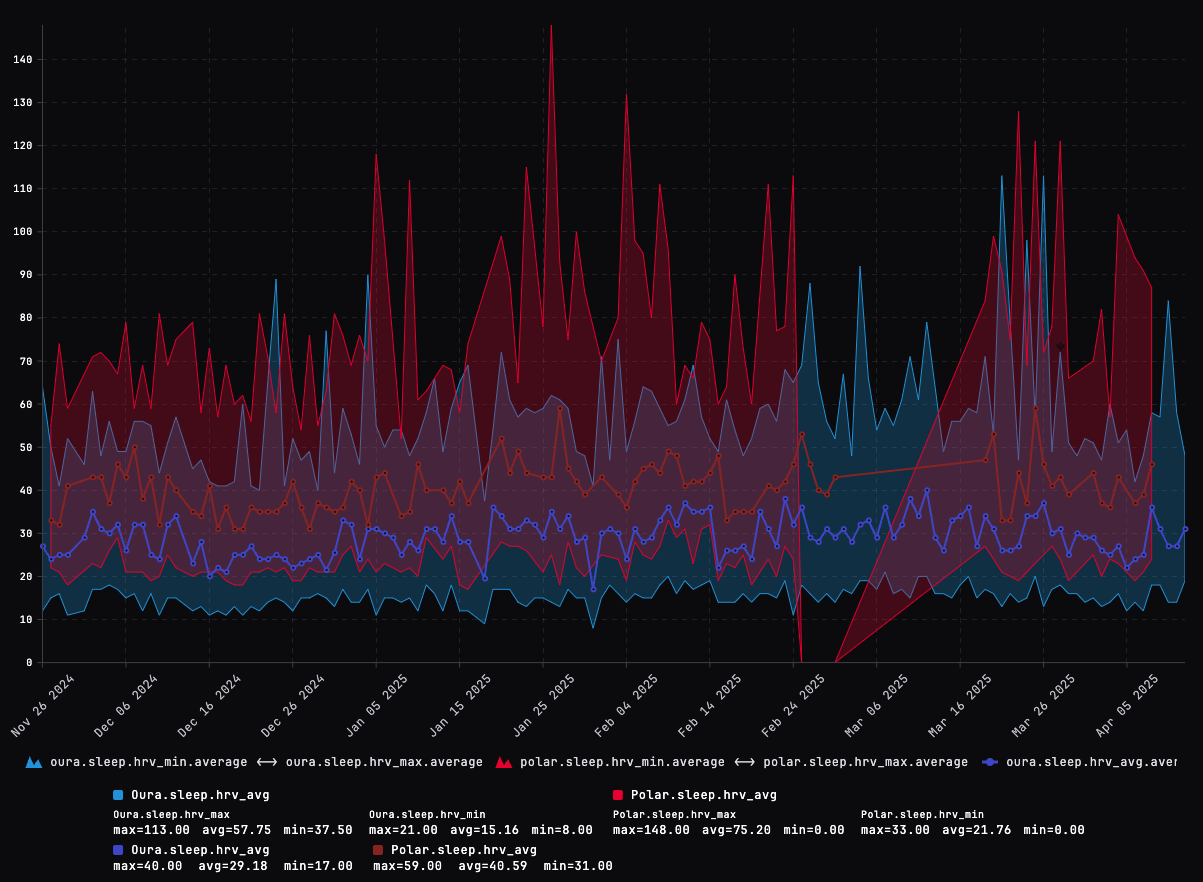
- HRV averages correlate weakly; Polar shows a higher baseline and more intra-night variability.
- For long-term tracking, consistency within one device matters more than cross-brand matching.
This post explores high‑level differences between Oura and Polar sleep data using long‑term trends. Rather than focusing on specific nights, we look at nights over time.
Oura vs Polar Sleep Metrics Compared
We compare the following raw (no sleep scores and such clearly created by algorithms) sleep metrics:
- Total sleep duration
- Sleep start time
- Sleep end time
- HR
- HRV
The data was gathered from 2 different time periods where oura gen 3 (2022) or gen 4 (2024/25) was used. Polar device was either Polar Pacer Pro (2022) or Ignite 3 (2025). Both periods are roughly 4 months long. Note that there are points in the data where one or the other device was not used.
Total Sleep Duration: Oura vs Polar
Sleep Start Time: Oura vs Polar
Sleep End Time: Oura vs Polar

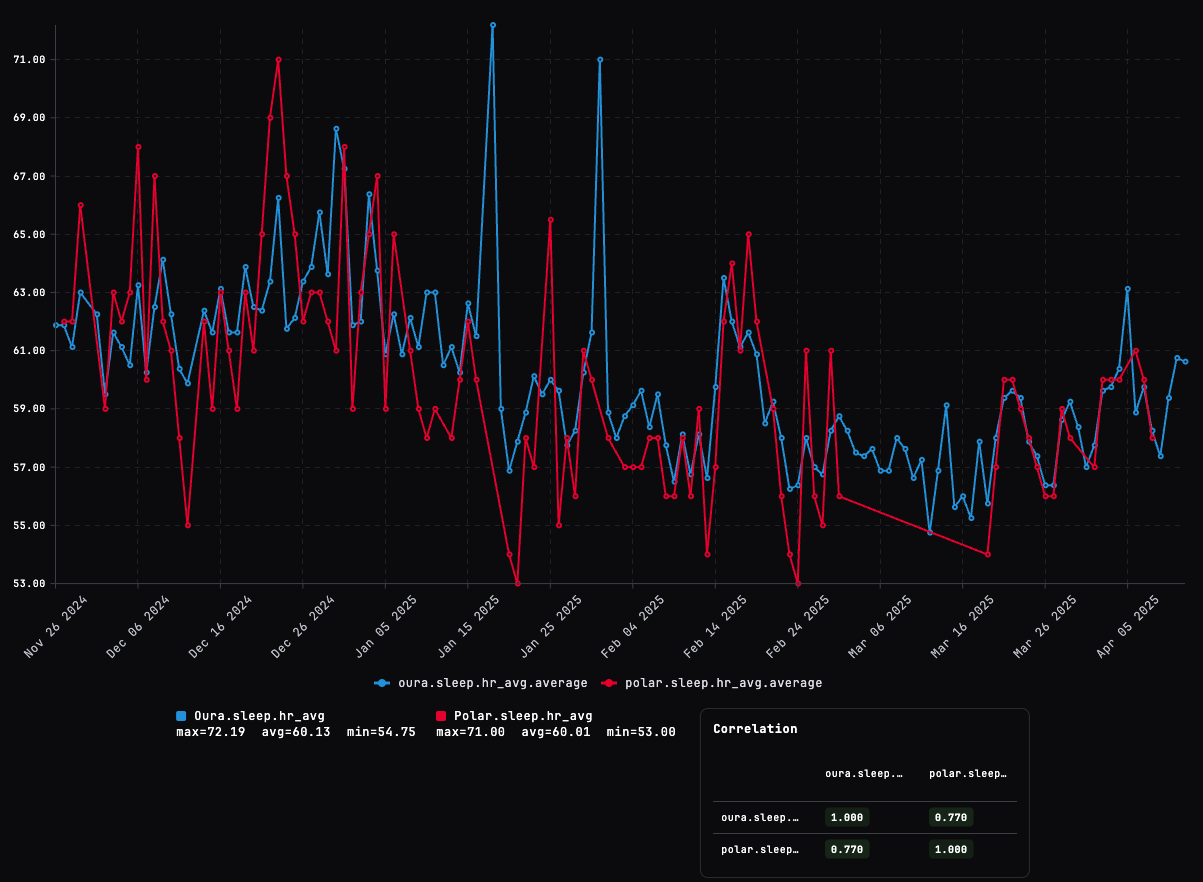
Resting Heart Rate (nightly averages): Oura vs Polar

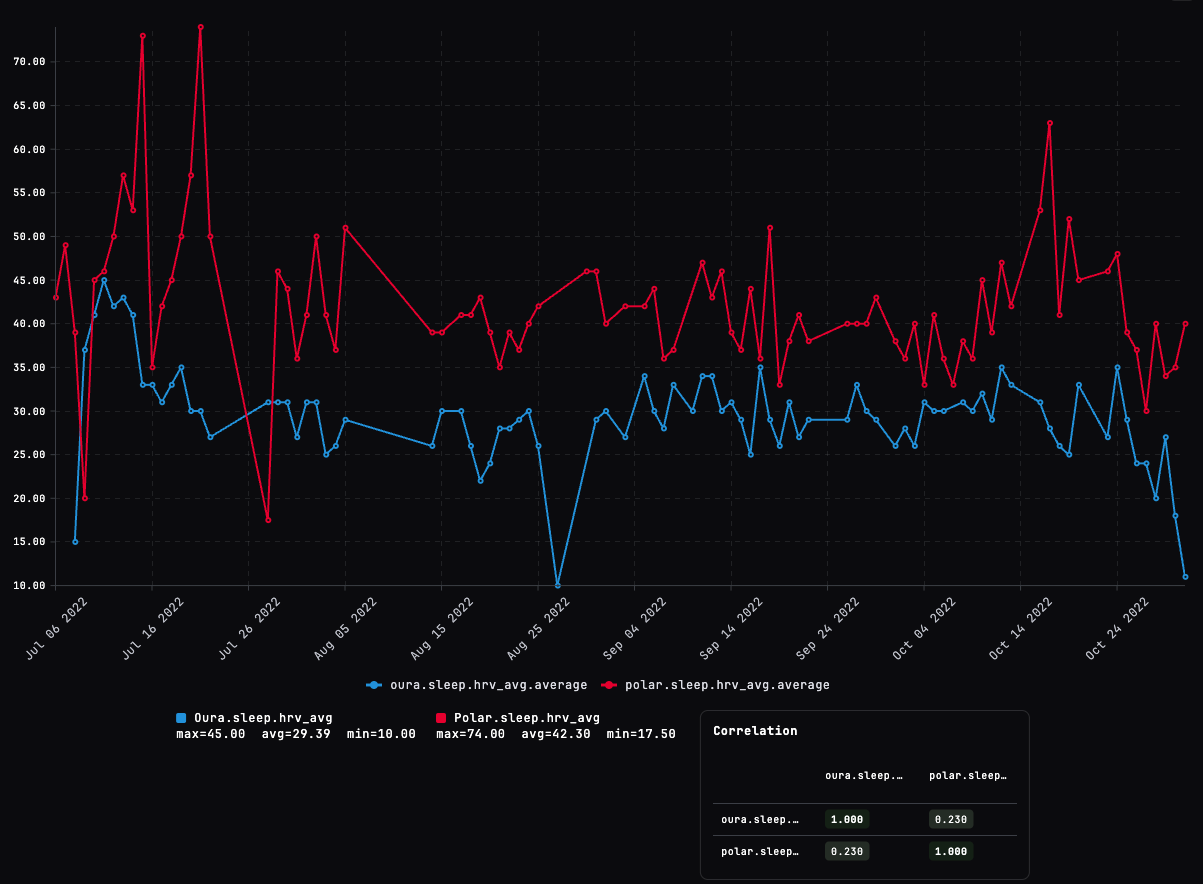
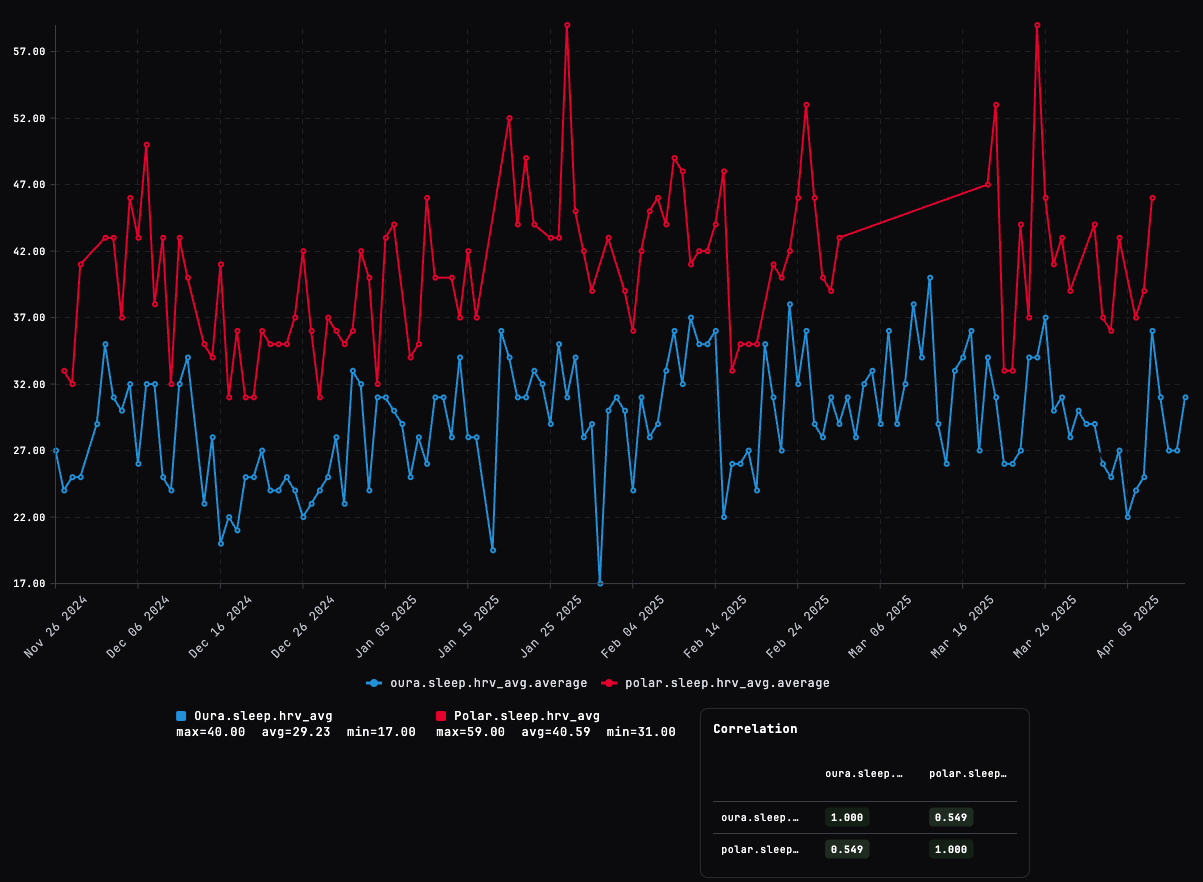
HRV (RMSSD, nightly averages): Oura vs Polar
HRV Range (nightly min–max; average line): Oura vs Polar

Takeaways: Oura vs Polar Sleep Data
The start times of sleep are almost surprisingly same, the averages are very close. I somehow feel like both of them are a bit optimistic and dont reflect the reality when I have fallen asleep. Also the end times and durations are somewhat similar. The averages would probably quite close to each other if some outlier points were removed. For the HR and HRV there is also Pearson correlation shown (Pearson because linear correlation is to be expected, the values should actually be the same after all). HR shows moderate (0.656) to strong (0.770) correlation between the two data sources. The averages are basically same for HR in both of the periods, and from rough visual inspection the trends look similar. HRV is more interesting. In the first period there is basically no correlation (0.230) and the second period also shows quite weak correlation (0.549) This is is of probably explained by the fact that the HRV is not as raw data as the HR, but there is some algorithm which calculates the HRV. Both Oura and Polar still measure the HRV as RMSSD and their APIs give the data in 5-minute samples. Also the baseline of HRV is quite different Polar seems to have a higher baseline HRV than the Oura value. This is not really a problem if you would wear the same device for long period of time, the data is still comparable. There is also a range graph which shows the nights min and max HRV readings which show that the Polar measurements are quite "jumpy". There is quite high variablity within a single night and especially the peaks are high. Overall you can't really say that one of these devices are better than the other. Personally I have recognized the same pattern as shown here for the Polar HRV measurements and I trust the Oura output data for that metric more.
Build This in Athilio
You can create these comparisons and more with Athilio's desktop software by selecting the metrics you want and visualizing it as daily, weekly or monthly aggregates, even period-over-period type of comparisons are relatively easy to create. You have access to your whole historical data from Oura, Polar and Garmin. All of the visualizations you create can be used in your own dashboards for constant monitoring.